Contextualized contact networks
By collecting the list of visitors, workers and guests at an instance of a service at any given time, we naturally know the collective history of the community and the sets of agents that can interact. However, how these agents interact is closely associated with the social context at that time. As examples: one does not interact closely between tables in a restaurant while the waiter interact with the set of tables it is responsible for as well as coworkers; in a classroom or factory, people are rigidly placed in space for most of the time.
We therefore need to consider the social context of the agents in the process of taking the list of agents in a location and producing a contact network. COMORBUSS identifies each particular service having its own network structure, so distinct network models are built when representing restaurants, markets, hospitals or schools.
All network models share as a common feature to contain in each service two types of individuals: workers and guests. Workers of a particular service are individuals which stay in this service over a daily time period during a realization of the stochastic community. On the opposite, guests are individuals which visit a single time step that service respecting a frequency of visitation over the simulation.
Both types of individuals are specialized for each service to mimic realistic features one may find in real-world services. For instance, waiters in restaurants are modelled as workers having contacts with visitors. The same idea is applicable to cashiers in markets. Hence, these observations also must be taken into account in the modelling of contact networks. Below we detail the network model for each service.
Contact varying with agglomeration
Each of the contact networks exposed in the sections below assume a fixed number of agents in order to distribute contacts at a given time step. However, this number may vary along time steps for several reasons. For example, in the case of markets, there are rush hours in which agglomeration is higher. It is also common in this type of service that visitors visit less in the first hours of the day, as well as in the last ones. To deal with the non-uniformity of the number of agents inside each service, we propose a formula to adjust the average number of contacts. The idea comes from supposing that the opportunity for a contact is directly linked to the available space to the agents.
Suppose that two of N agents get in contact with each other whenever they share some specified area A around their position in space. The expression relating c_{avrg}(N), A and N is given by \begin{equation}\label{eq:rand_walk_avrg_cont} E(c_{avrg}(N)) = \frac{\frac{N(N-1)}{2}A}{N} = \frac{N-1}{2}A, \end{equation} where E is the expectation operator. This formula comes from assuming random walking of N agents inside a given service with transit area A. To avoid knowing the transit area, we suppose that a sample N_0, c_{avrg,0}:=c_{avrg}(N_0) is collectable, and then we approximate A through the formula \begin{equation} A\approx \frac{2c_{avrg,0}}{N_0-1}. \end{equation} As a result, the expression for the mean number of contacts c_{avrg}(N) varying with the number of agents N is \begin{equation}\label{eq:aggl_cont} c_{avrg}(N) \approx c_{avrg,0}\frac{N-1}{N_0-1}. \end{equation}
Equation \eqref{eq:aggl_cont} is used in some of the contact networks introduced below. For example, in the case of markets, supermarkets or street markets, the formula can be used to adjust the average number of contacts among visitors shopping in the services. In the case of hospitals, the formula can be used in the average number of contacts among visitors. Another place where such expression is useful is in the contact network for homes. Assuming equally sized homes, one can infer that the more people at home, the more contacts. Since the number of people at home varies along the day, such formula is well fitted to capture the dynamics of movement inside a home.
Standard networks: houses and generic services
In houses or generic services, no network configuration can be assumed. As a result, we utilize a standard network model in order to generate contacts. The contacts in this model are randomly distributed for each agent according to a given average number. This average value may change as the number of agents increase or decrease inside services, as discussed in Section \ref{sec:aggl}. Nevertheless, the contact networks generated are still dynamic, varying as agents are added or removed.
The contact networks are, with few exceptions, generated using Erdos-Renyi model, where the probability p_{ER} of an edge being added is given by p_{ER} = c_{avrg} /(N − 1). Here c_{avrg} is the average number of contacts and N is the total number of nodes in the graph. The parameter c_{avrg} depends on the definition of contacts, and in this work we assume it to be the following: “two people at two meters or less away from each other for the duration of one hour”.
Networks for environment layer
The dynamic of contacts in environment layers is very individual-specific, and therefore we approximate it by random walking. The formula for the average number c_{avrg} of contacts among N agents in the environmental layer with transit area A is given by equation \eqref{eq:rand_walk_avrg_cont}. The transit area A is in this case given by: \begin{equation} A = \frac{\pi r^2}{A_u}, \end{equation} where r is an \textit{infection radius}, and A_u is the urban area available in the environment layer. The infection radius is given by half of the largest distance between two agents such that they can be considered to be in contact. We assume 2 meters as a default value.
Although at random, contacts may follow some tendency according to the age of agents. We have used the probabilities exposed in the figure below, which have been derived from Table 2 of \cite{DelValle2007}.
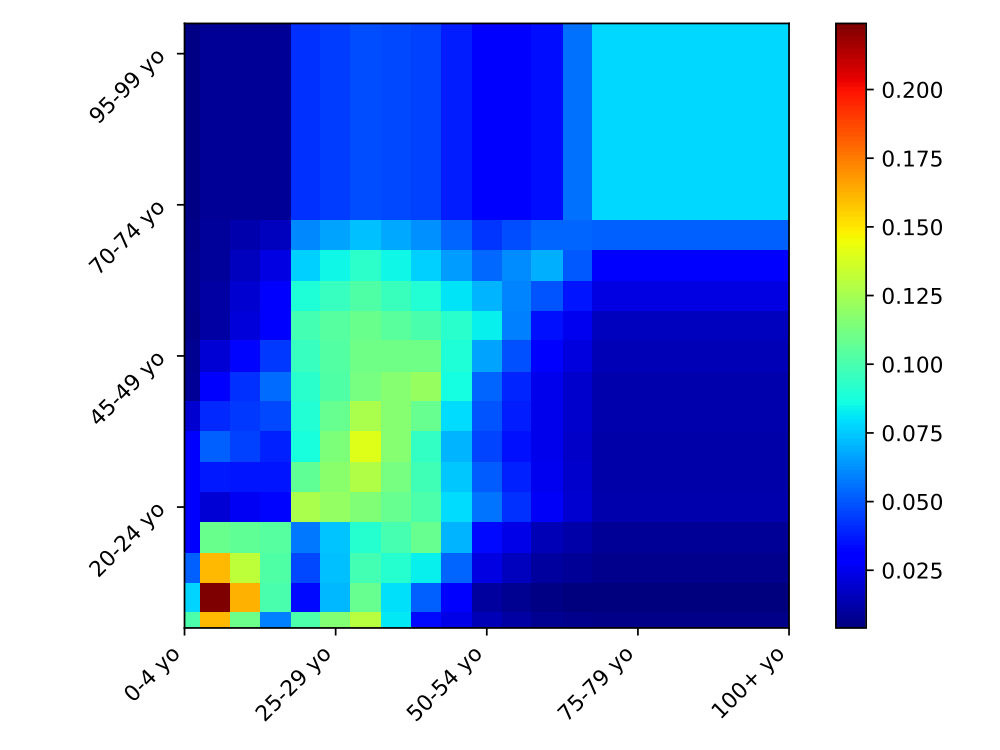
Color map representing probabilities that if a person from an age group in the y-axis met someone, that person belongs to the age groups in the x-axis.
Network for restaurants
Waiters are restaurant workers who have the greatest potential of becoming disease super spreaders inside their work place. This happens because they get in contact, as a group, with every visitor who enters the restaurant. As a result, waiters define a special group of workers which must have special treatment regarding their contact network.
Taking into account the social roles of waiters in restaurants, we model contacts in three categories:
visitor-visitorcontacts.waiter-visitorcontactsworker-workercontacts.
Having these categories in mind, the contact networks for restaurants are configured by setting the following parameters: the portion of workers who are waiters, the average number of contacts among workers, and the mean number of persons seating around the same table. Because this last parameter is usually difficult to estimate, it can be discarded, in which case tables are evenly distributed among waiters in the restaurant.
The contact network for workers is randomly created, always respecting the mean number of contacts provided as input. Among these workers are those composed of waiters, who get in contact with every visitor on the tables they serve. These visitors in turn get in contact with everyone else in the same table.
The figure below shows an example of a network for a given restaurant with 5 visitors, 2 waiters and 3 other workers. Notice that only the waiters, identified by ids 1878 and 867, are those who get in contact with the visitors. It is clear, however, that other workers get in contact among themselves. The same thing happens to visitors in the same table.
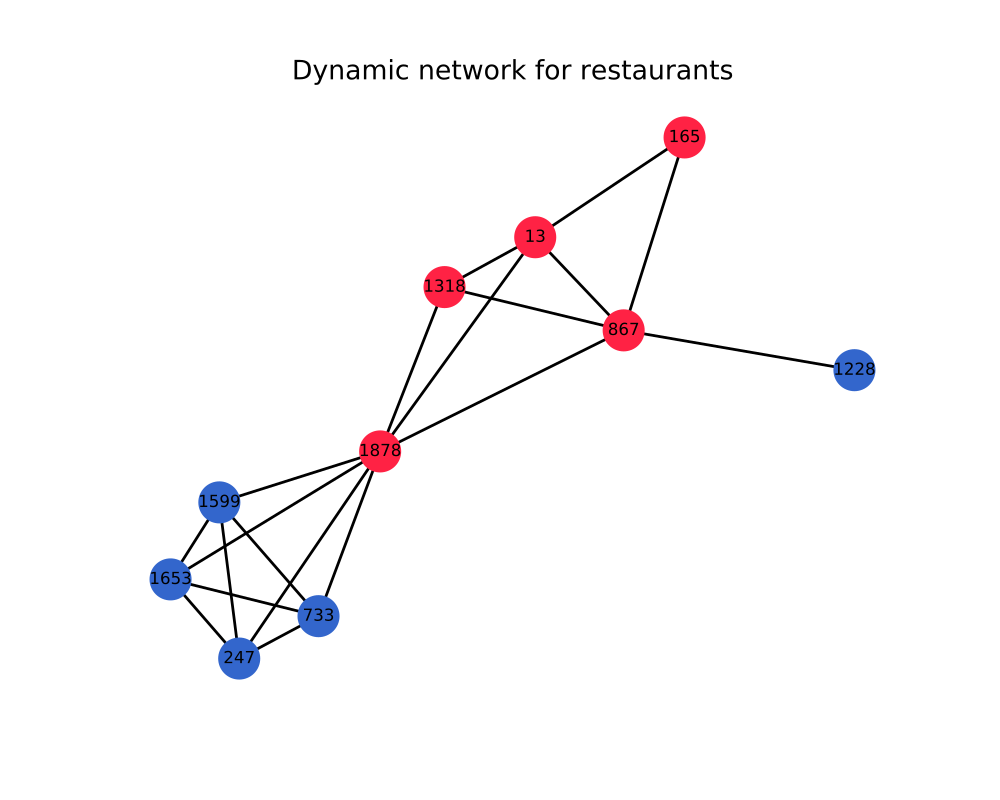
Example of a dynamic network for restaurants. Agents (with their ids in circles) in red are workers, agents in blue are visitors. Numbers inside each circle represent the identification number of that agent.
Network for markets
The contact network for markets is similar to that of restaurants in the sense that there exists a class of workers which needs different treatment: the cashiers. While other workers usually do not get in contact very frequently with visitors, every visitor mandatorily gets in contact with a cashier, either directly or indirectly through shared surfaces, such as shopping belts or credit card machines. Second order contacts include those among visitors and among workers.
The contacts between workers and visitors is randomly created, respecting a given average of contacts provided as input. The contacts between visitors and cashiers is also random, but in this case each visitor is assigned to a cashier. Cashiers are fixed agents, which comprise a fixed proportion of all workers in markets.
The figure below shows an example of a network for a market. Notice that every visitor (blue agent) gets in contact with at least one worker. Cashiers are workers (red agents) who get in contact with many visitors. Example of cashiers in the figure are those with ids 1479 and 9059. Example of non-cashiers are those with ids 1922 and 2059
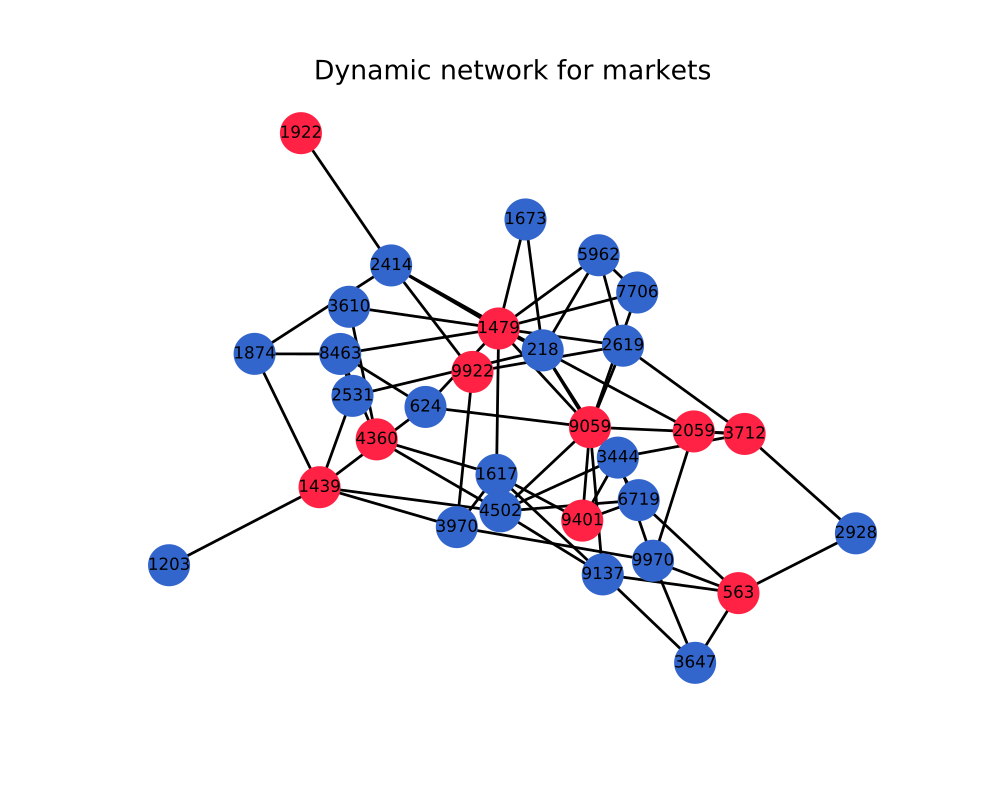
Example of a dynamic network for markets. Agents (circles) in red are workers, agents in blue are visitors. Numbers inside each circle represent the identification number of that agent.
Network for schools
Schools have two different network models: one for class time, and one for break time. During classes, the nature of contacts among students can be very geographic, since students tend to stay seated during long periods of time. During breaks, students are free to walk around public spaces inside the schools. As a result, the distinction between two types of networks is needed.
During class time, we propose a network that connects agents according to the neighbors nearby, where students are assumed to follow a geographical disposition of a rectangle. Teacher are treated separately, since they usually move more frequently. The contact frequency between a student and a teacher may vary according to the age of the student. For example, for students who are toddlers, the contact is frequent, but for university students, direct contacts are unusual. The parameters for this type of network are the number of students in a class, and the average number of contacts between teachers and students.
During break time, we propose a simple network in which students get in contact at random. The factor that influences the most this type of network is the number of classes allowed to have a break together, as well as the different ages of the students. The parameters for this network are the number of classes to have break together and the average number of contacts among students.
The figure below shows a network for classes inside a school. The teacher is identified by the id 1772.
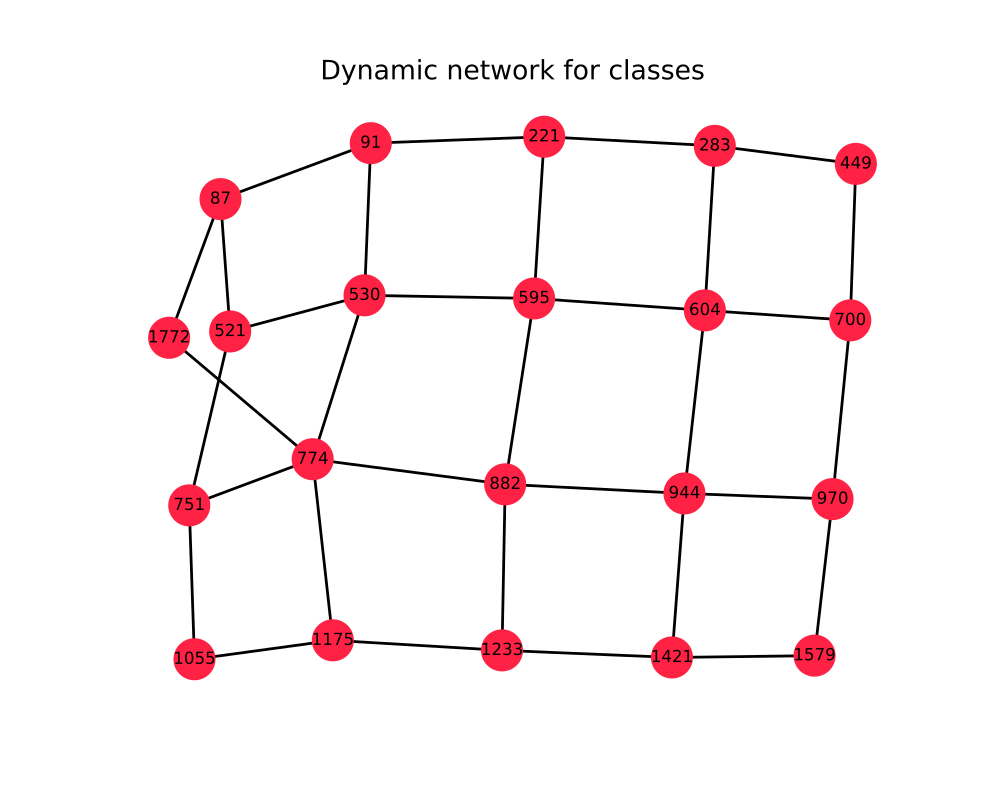
Example of a dynamic network for classes in schools. Students are geographically positioned in lines, with one teacher in charge.
Network for hospitals
Networks for hospitals have, in addition to workers and visitors, admitted persons (hereby labelled guests), which stay in the facility for long periods of time. While these people are admitted, they get in contact with only a few hospital workers. The workers, on the other hand, get in contact with other workers, with some getting in contact with visitors as well. Visitors are yet another type of individuals which comprise those who seek help in the occasional sickness, as well as those only visiting admitted persons. The need to distinguish between three types of agent makes this type of network more complex than those introduced before. Another source of complexity is the fact that some workers are assigned to deal with a specific disease in a pandemic scenario, an attempt to contain the spread of the disease among workers.
Contacts for visitors are adjusted by providing the average number of contacts among themselves, to the workers of the hospital, and to the admitted persons. Contacts among workers take into account the two classes of workers: typical workers and disease workers. The average number of contacts among typical workers, among disease workers, and between typical workers and disease workers must be provided. This last number is typically very small. Finally, the average number of contacts between admitted persons and disease workers is a key parameter, which can determine the spread of the disease in the hospital.
The figure below exemplifies the network for hospitals. Agents with ids 567, 7372, and 4955, in purple, have been admitted to the hospital. Agents 9943, 7828 9345 are disease workers, the only workers to get in contact to the admitted people. However, they may as well get in contact with other workers, in the figure, exemplified by the contact between agent 9345 and agent 435. This last worker may get in contact with another worker, exemplified by its connection to agent 1132. Workers also get in contact with visitors, which can be seen by the connection between agent 435 and agent 8391. Finally, several visitors (in blue), also get in contact among themselves, as exemplified by the connection between agent 517 and agent 9300.
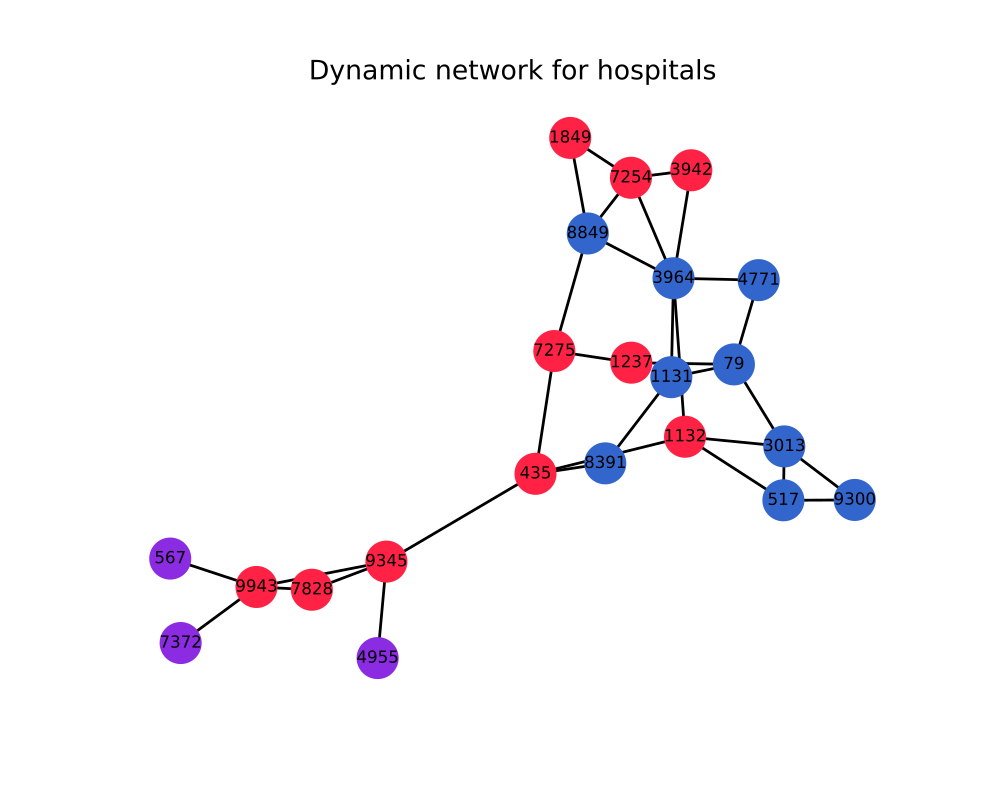
Example of a dynamic network for hospitals. Agents (circles) in red are workers, agents in blue are visitors, and agents in purple have been admitted to the hospital. Numbers inside each circle represent the id of that agent.